address-card-duotoneapple-payarrow-right-to-bracket-duotonearrow-up-dotsbell-duotonebox-taped browser-duotonebullhorncalendar-week-duotonecart-shopping-duotonecircle-check-duotonecircle-chevron-right-duotonecircle-info-duotonecredit-cardear-duotonefile-chart-pie-duotonefile-invoice-duotonefilter-list-duotone-solid-fullfire-duotonehandshakekeyboard-duotonelayer-plus-duotonelist-duotonemap-duotonemenumoney-check-duotonemoney-uppaypalrepeat-duotonerobotrocketscreen-users-duotoneserver-duotonespiffy-logo-whitestripetags-duotonewand-magic-sparkles-duotonewindow-restore-duotone
Feature

Reports & Analytics

See where your checkout wins and leaks. Spiffy's checkout analytics gives you real‑time dashboards, custom reports, and AI‑powered insights to improve conversion, reduce failures, and grow revenue.

Turn Your Data
Into Growth

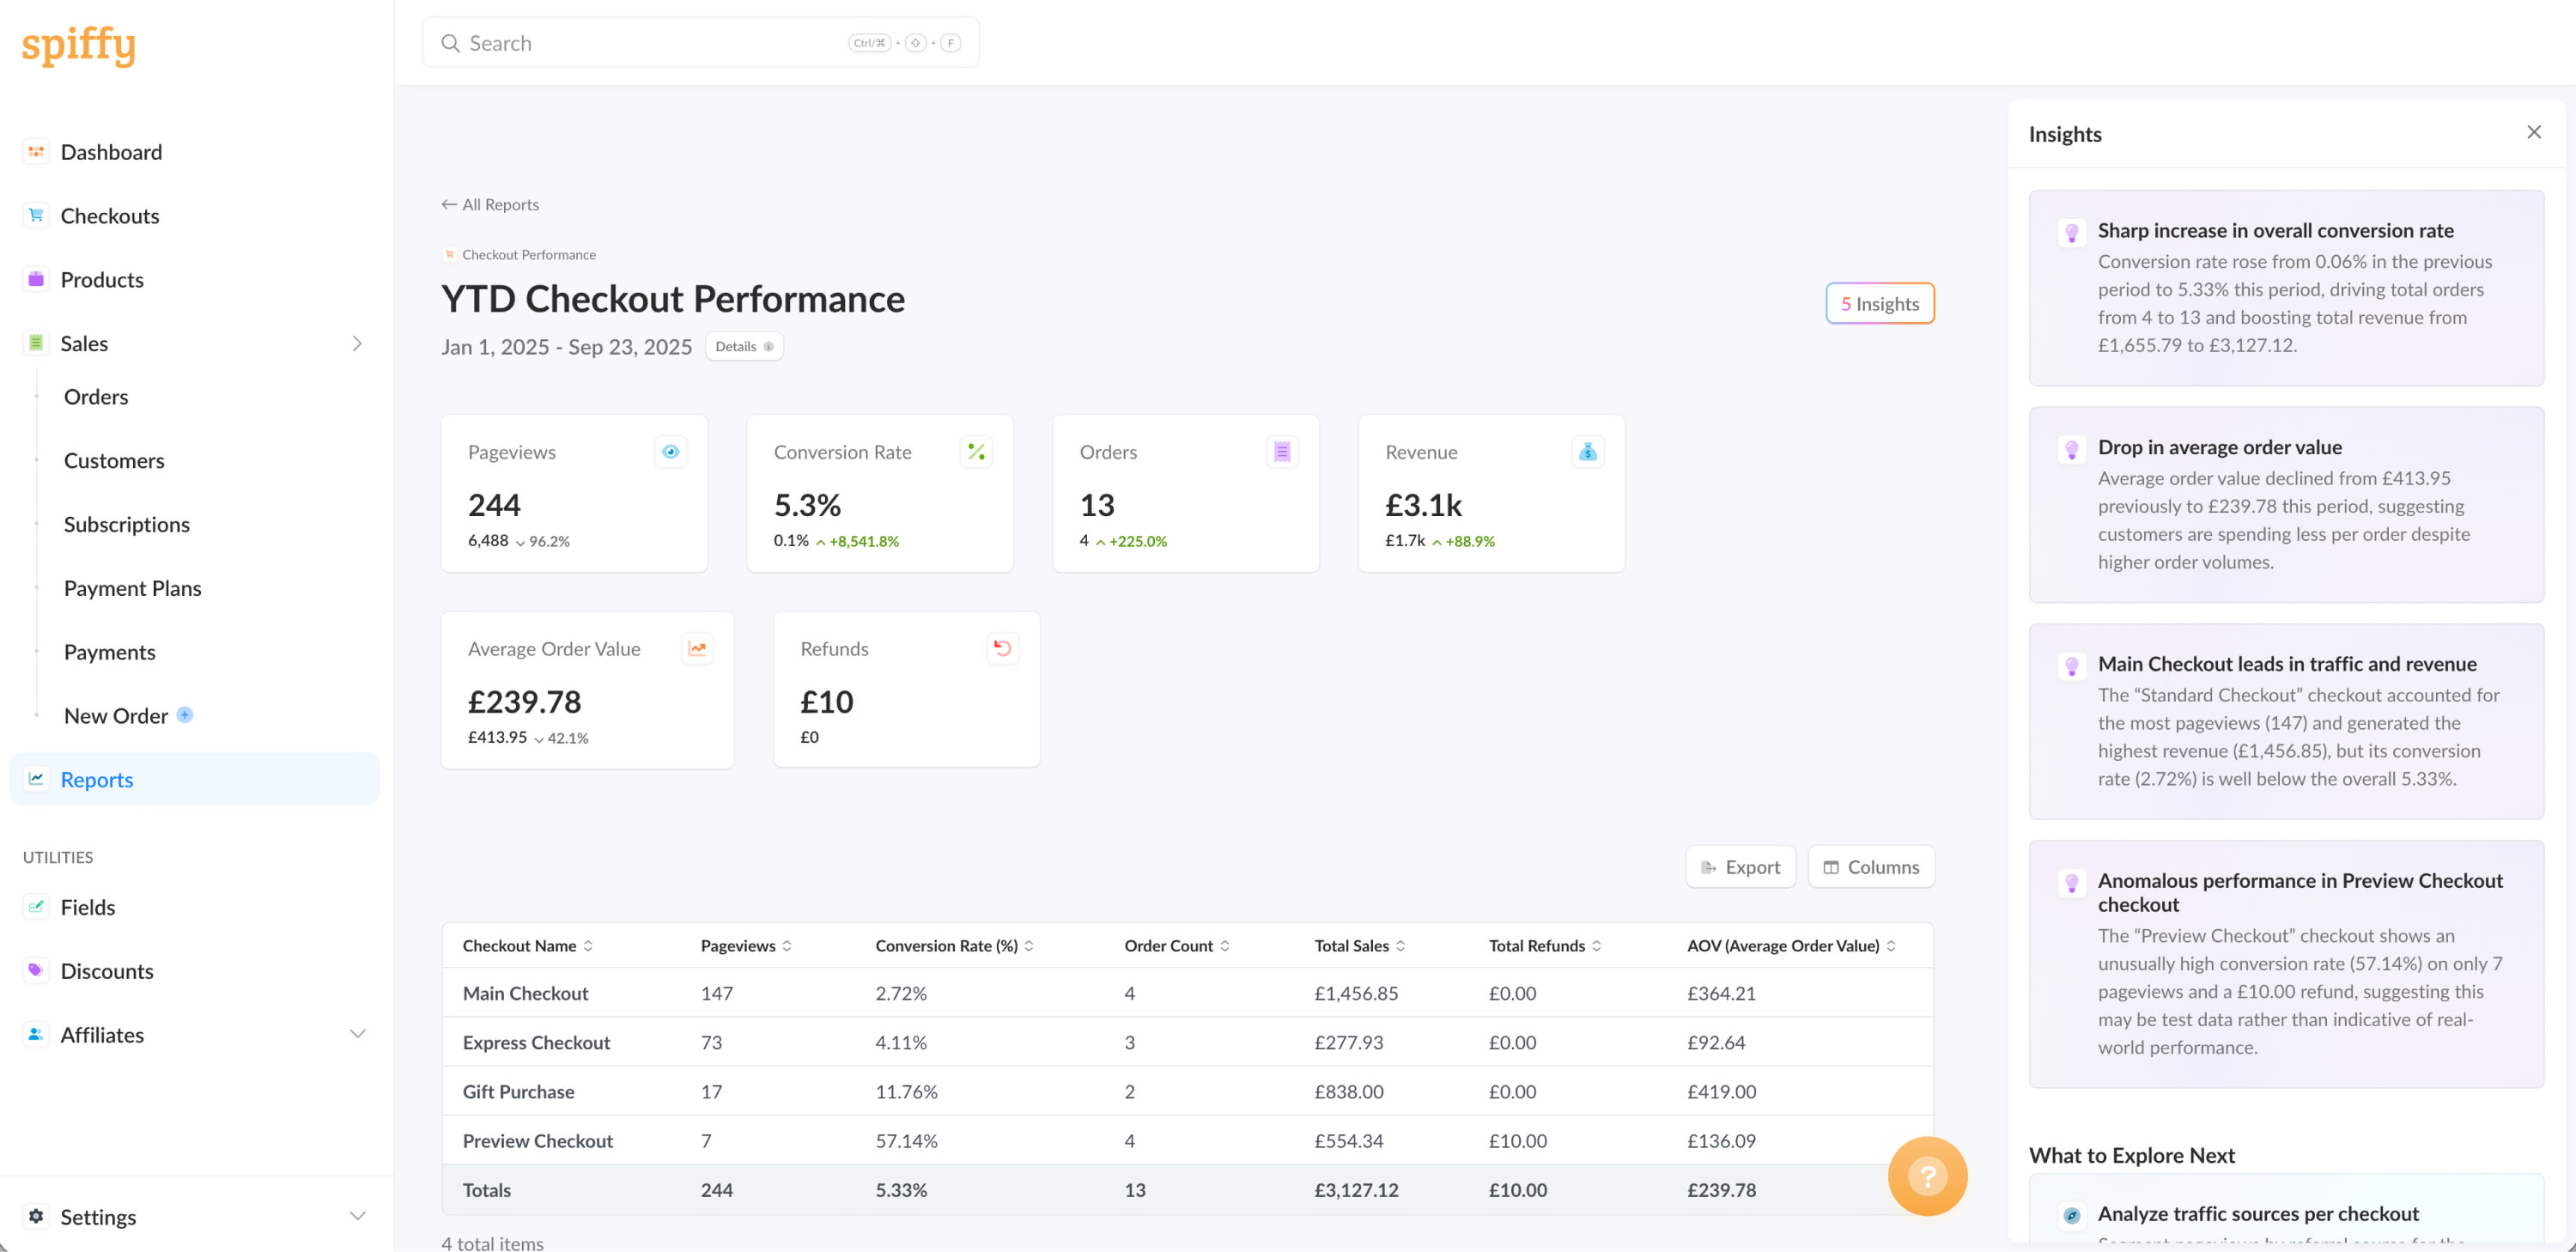
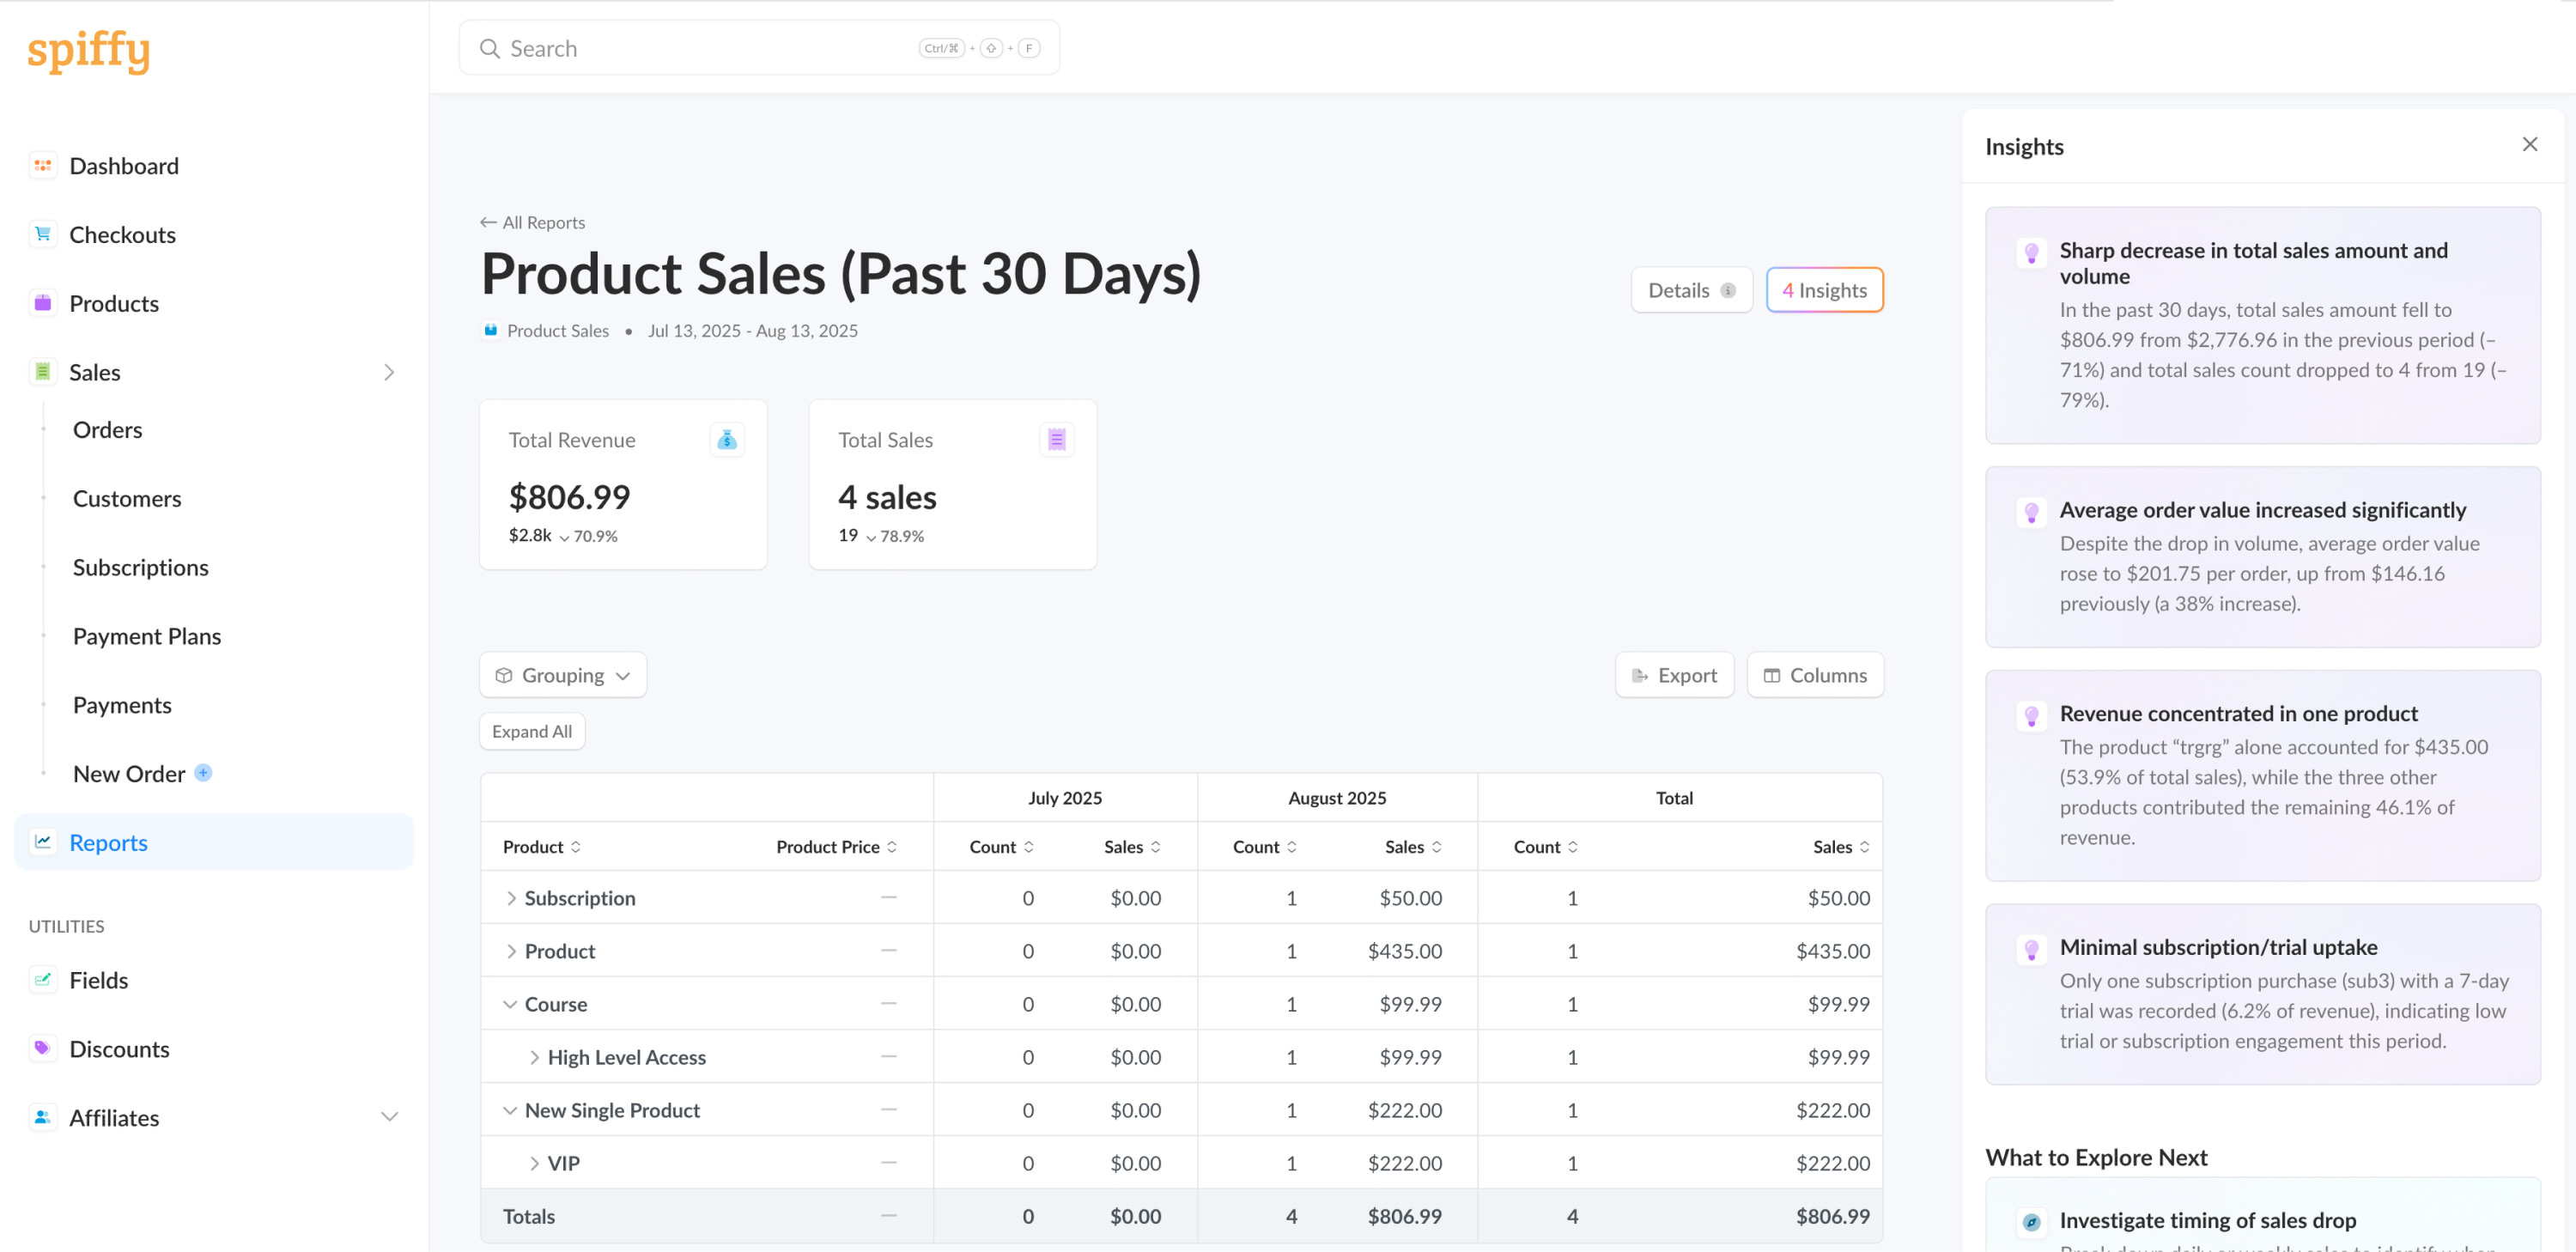
Get powerful insights to grow your business with checkout analytics, revenue analytics dashboard, and AI‑powered insights. Turn your data into actionable recommendations that help you make smarter decisions.

Custom Reports

Build tailored reports with flexible configuration and custom filters

Revenue Analytics

Track revenue growth, order performance, and payment success rates
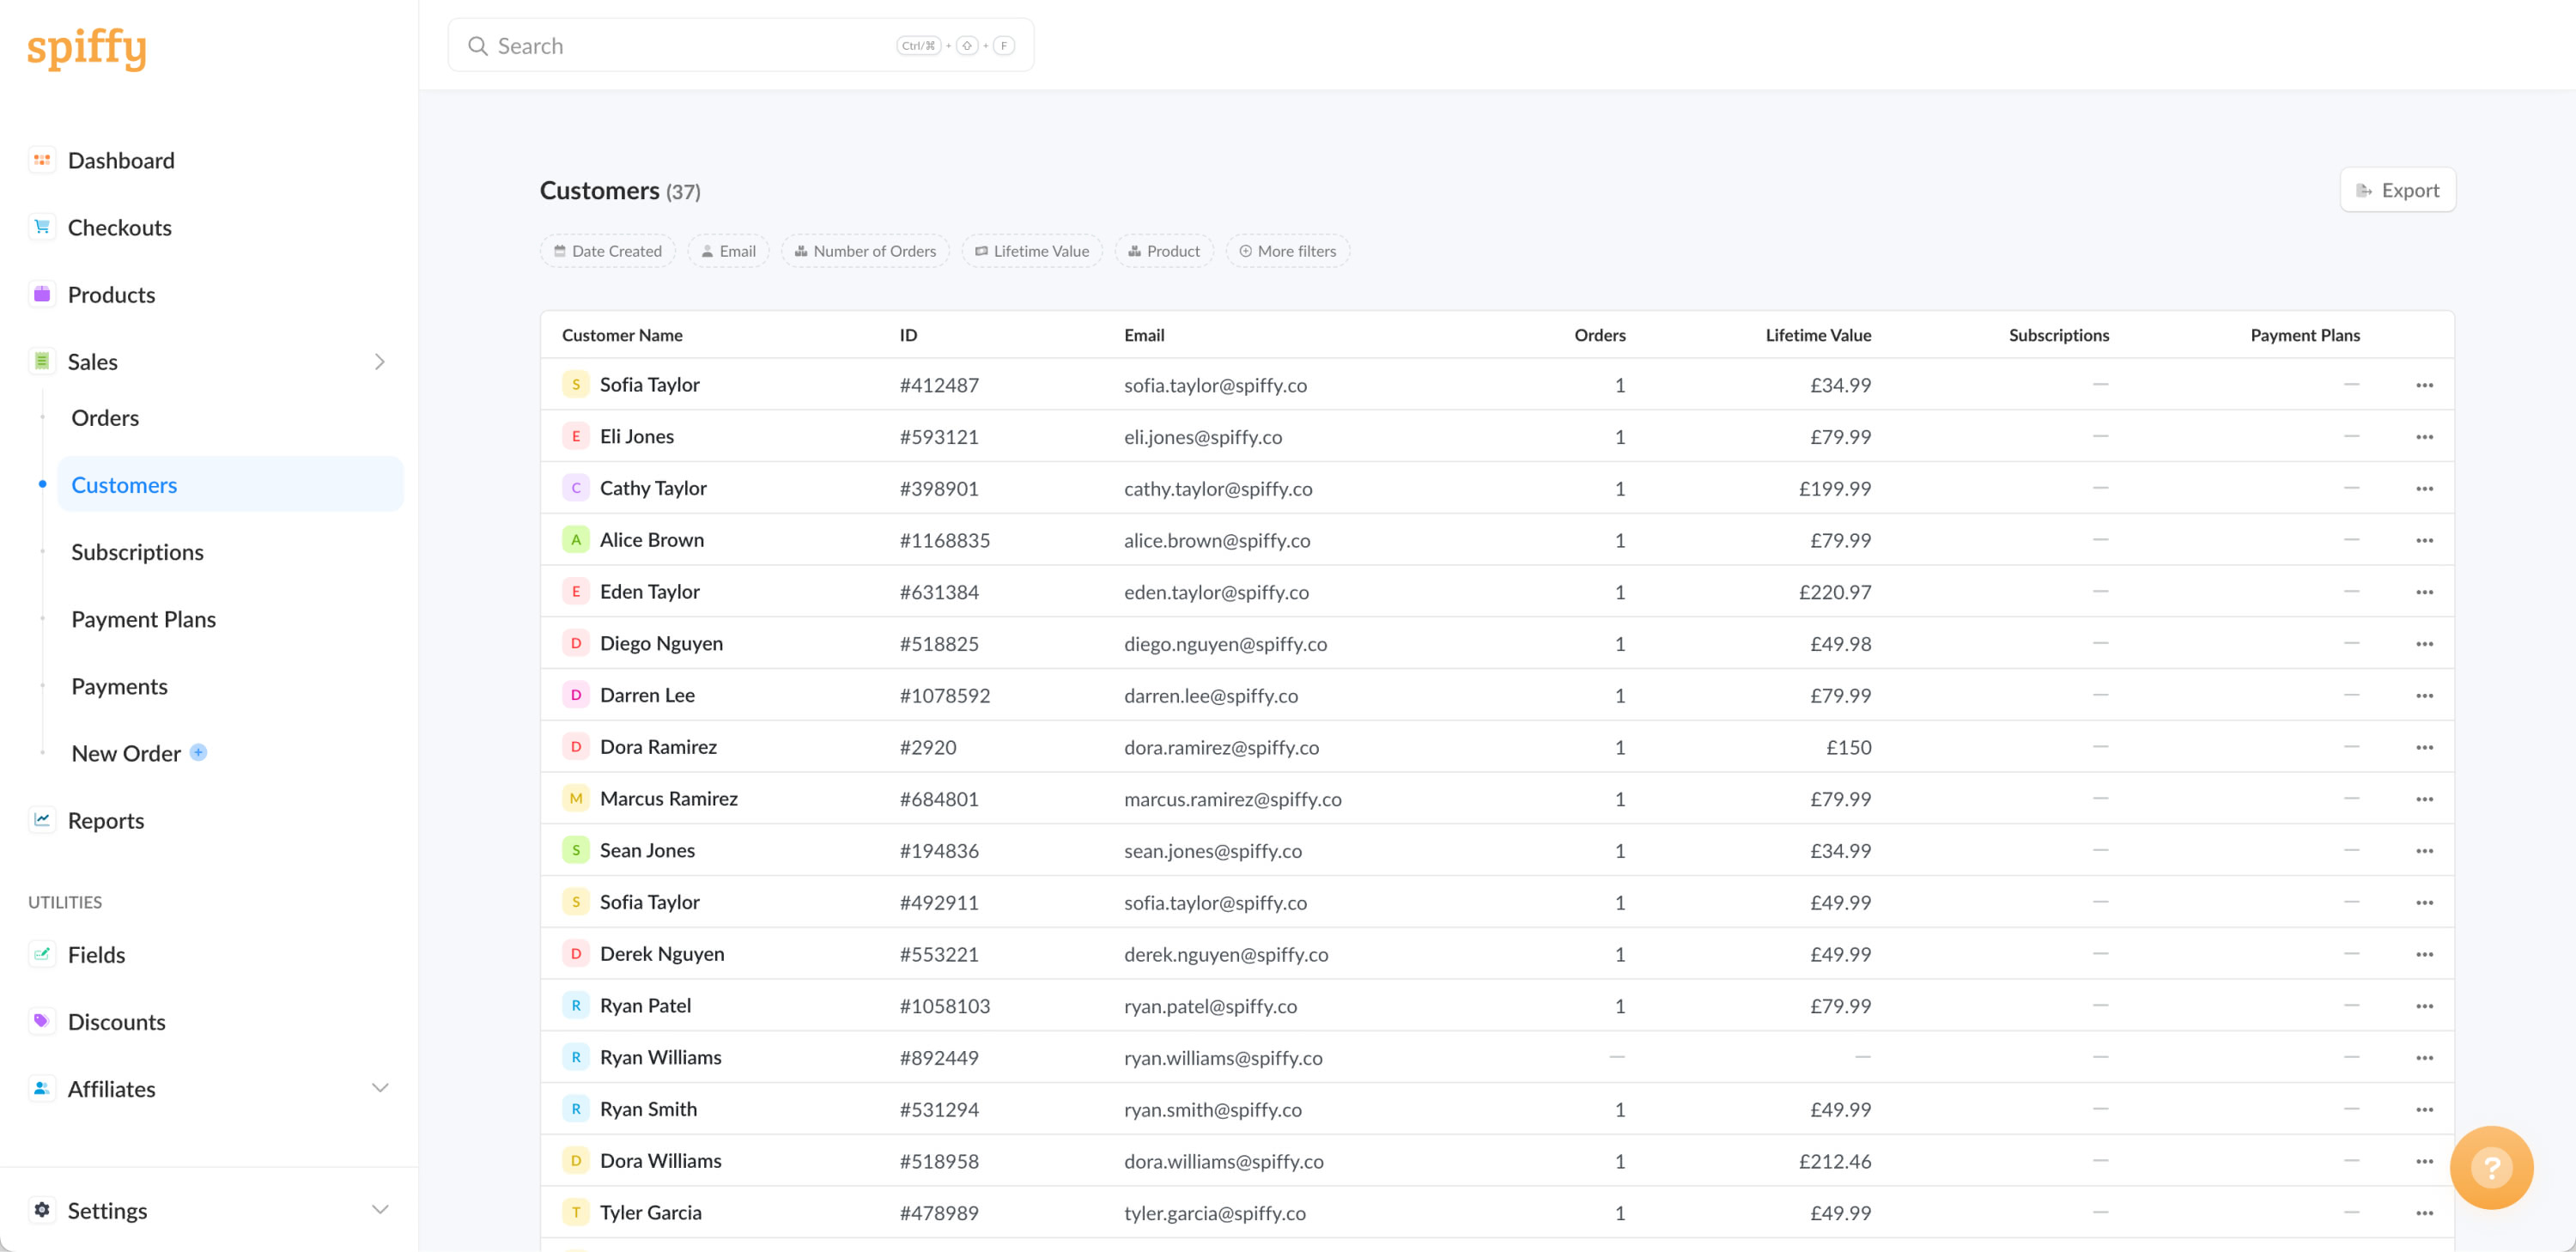
Customer Insights

Understand customer behavior and lifetime value for better retention

AI-Powered Insights

Get automated insights and actionable recommendations from your data

Advanced Views

Multiple analytics perspectives for better business insights

Data Export

Export reports to CSV for external analysis and business intelligence

Scheduled Reports

Automate your reporting with scheduled reports sent to your team

Performance Dashboards

Real-time dashboards with key metrics and performance tracking

app.spiffy.co/reports/checkouts
Checkout analytics dashboard
Product Analytics

Find Your Best-Selling Products

Discover which products make you the most money with product analytics, product sales report, revenue by product, and product performance comparison. Real-time dashboards show exactly where your revenue comes from.

  • See which products make you the most money
  • Find your best-performing products instantly
  • Compare product performance side-by-side
  • Product-level vs checkout-level performance views
  • Export data to make smarter business decisions
Learn More

Product Sales Report

Generate custom product sales reports that show you exactly where your money is coming from and which products are driving growth.

app.spiffy.co/reports/products
Product revenue analytics dashboard
Product Sales Report

Track Product Revenue

See exactly which products bring in the most revenue and which ones to focus on for better results.

  • Revenue by product
  • Sales volume tracking
  • Product performance comparison
Product Performance Stats

Track What's Working

See which products are selling best and which ones need attention with real-time performance data.

  • Product dashboard statistics
  • Product performance tracking
  • Performance insights
Checkout Analytics

Stop Losing Sales at Checkout

See exactly where customers drop off with checkout performance report, checkout conversion analytics, and failed payment analytics. Fix your checkout to convert more visitors into paying customers.

  • See exactly where customers abandon checkout
  • Find out why payments are failing
  • Fix checkout problems to boost conversions
  • Turn more visitors into paying customers
Learn More

Checkout Performance Report

Generate custom checkout performance reports to identify bottlenecks and improve your sales funnel and customer experience.

app.spiffy.co/reports/checkouts
Checkout analytics dashboard
Checkout Performance Report

Improve Your Checkout

See exactly where customers drop off and optimize your checkout to turn more visitors into paying customers.

  • Checkout completion rates
  • Take rate analytics
  • Conversion tracking
Failed Payments Report

Reduce Failed Payments

Identify why payments are failing and take action to reduce failed transactions and improve revenue. Pair with payment failures/dunning automation for automated recovery.

  • Failed payment tracking
  • Payment recovery rates
  • Gateway performance
Customer Analytics

Keep Your Best Customers Longer

Find your most valuable customers with customer analytics, customer lifetime value (LTV) report, and churn indicators. Keep them coming back with insights into who spends the most and how to improve retention.

  • Find your most valuable customers
  • See which customers are likely to churn
  • Track affiliate and referral performance
  • Keep customers paying longer
Learn More

Customer Analytics Dashboard

Understand your customer behavior with analytics that help you improve your marketing and retention strategies for better customer relationships.

app.spiffy.co/customers
Customer LTV report dashboard
Lifetime Value Report

Find Your Best Customers

See which customers are worth the most and focus on keeping them happy to maximize your revenue.

  • Customer lifetime value
  • Revenue per customer
  • Customer value insights
Customer Performance Metrics

Keep Customers Paying

See which subscribers are likely to cancel and take action to keep them paying longer for more revenue.

  • Subscriber analytics
  • Churn rate tracking
  • MRR & revenue metrics
Affiliate Analytics

Track Referral Performance

See which affiliates and referral sources bring in the most valuable customers and track commission performance.

  • Affiliate performance tracking
  • Referral source analytics
  • Commission reporting

Colette Kelly

Operations Manager at Counseling Tutor

We are so glad we have found Spiffy! Our failed payments have dropped from 14 – 19% on monthly subscriptions to a remarkable 3.5%. The analytics and reporting features help us track exactly what's working and what needs attention.

Advanced Analytics

Deep Dive Into Any Data You Want

Slice and dice your data with data export, scheduled reports, UTM campaign analytics, promo code usage, and gateway performance. Tie campaigns (UTMs) to actual revenue and failures, not just page events. Perfect for marketing teams, product strategists, and anyone who needs to understand performance at a granular level.

Marketing Analytics

Track marketing performance with UTM parameters, promo codes, and affiliate attribution to understand which campaigns drive the best results.

Report Filtering

  • Traffic sources
  • Campaign performance
  • Promo code usage
  • Affiliate attribution
Customer Segmentation

Analyze customer data by purchase history, lifetime value, login activity, and payment behavior to identify your best customers.

Report Filtering

  • Customer behavior
  • Purchase tracking
  • Lifetime value segmentation
  • Customer engagement
Product Strategy

Filter products by name, status, pricing options, affiliate programs, and creation date to analyze performance and make strategic decisions.

Report Filtering

  • Product performance
  • Pricing insights
  • Product ownership
  • Affiliate program tracking
Revenue Optimization

Filter orders by payment status, currency, total amounts, promo codes, and affiliate data to track revenue performance and optimization opportunities.

Report Filtering

  • Revenue stream analysis
  • Payment methods
  • Promo code usage
  • Affiliate tracking
Custom Date Ranges

Filter data by creation dates, payment dates, subscription events, and custom date ranges to analyze trends and performance over time.

Report Filtering

  • Trends over time
  • Seasonal patterns
  • Subscription lifecycle
  • Customer activity
Financial Analytics

Filter payments by gateway, card details, amounts, refunds, and payment types to track financial performance and payment method effectiveness.

Report Filtering

  • Payment methods
  • Card expiration
  • Refunds and chargebacks
  • 3D Secure transactions

Ready to get powerful insights into your business?

Risk-free for 30-days. 100% money-back guarantee.